
Qvista Views transform your DataTables into interactive visualizations that help you explore, analyze, and present your data. Whether you need structured lists, insightful charts, or fully interactive dashboards, Views provide flexible ways to organize information without modifying the underlying data.
Every View remains connected to its source DataTable, ensuring that any changes to your data are automatically reflected across reports, dashboards, and visualizations in real time.
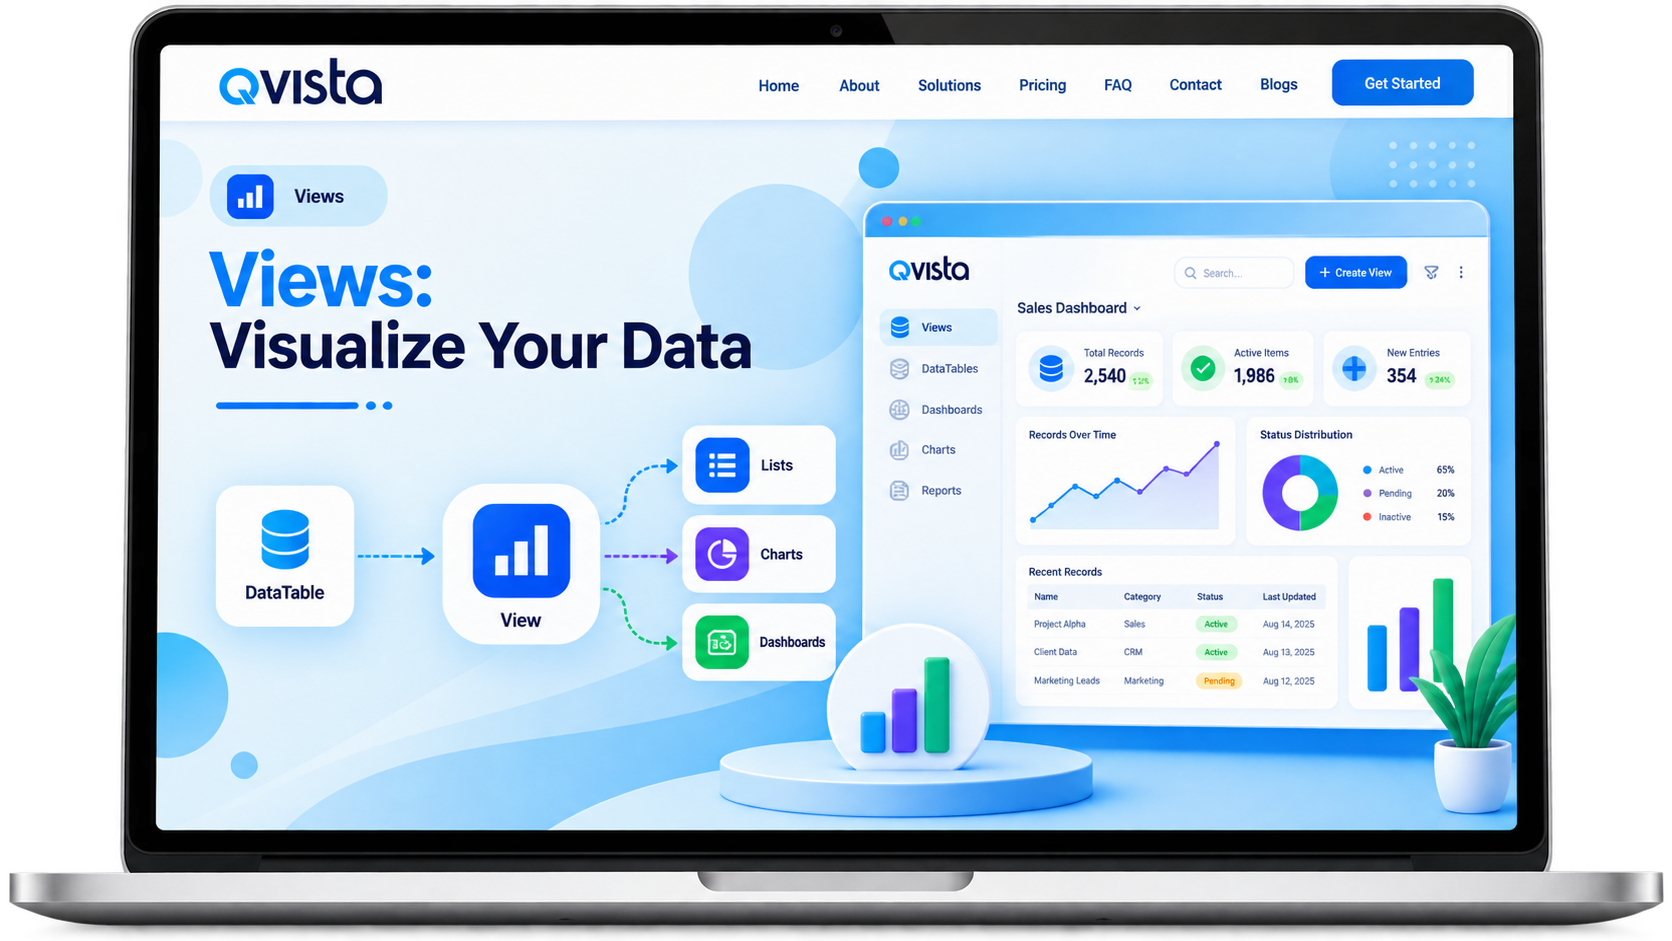
Create multiple Views from the same DataTable without duplicating or modifying your underlying records.
Structured tables for operational data
Charts to analyze trends and patterns
Combine widgets for complete insights
Display records in a structured table with filtering, sorting, grouping, search, pagination, and column customization.
Turn your data into interactive charts that make trends, comparisons, patterns, and relationships easier to understand.
Combine multiple widgets into a single interactive workspace for monitoring and business reporting.
Choose the visualization that best represents your data and customize it to match your reporting needs.
Bar, Line, Area, Pie, Donut, Scatter, Bubble, Histogram, Stacked Bar, Stacked Area, Heatmap and more.
Customize titles, axes, colors, labels, legends, sorting, filters, grouping, drill-downs, tooltips and more.
When your DataTable changes, every View updates automatically.
A simple workflow to create, customize, and share your Views.
Select the DataTable you want to visualize.
Choose List, Graph, or Dashboard View.
Apply filters, sorting, grouping, layouts, charts or widgets.
Use your View for reporting, monitoring, collaboration, export or sharing.
Create powerful lists to explore and manage your operational data.
| Name | Status | Total Orders | |
|---|---|---|---|
| John Doe | john@example.com | Active | 24 |
| Emma Wilson | emma@example.com | Active | 18 |
| Michael Brown | michael@example.com | Inactive | 12 |
| Olivia Smith | olivia@example.com | Active | 31 |
Combine multiple Views into a single workspace.
Share your Views securely or export reports for presentations and analysis.
Views never modify or duplicate your data. They provide different ways to work with the same DataTable. When the source data changes, all connected Views update automatically.

Explore the Qvista documentation to learn how to create Views, build charts and dashboards, customize visualizations, and share or export your reports.